There is so much data in the Incyte database that novel methods are needed to make sense of it.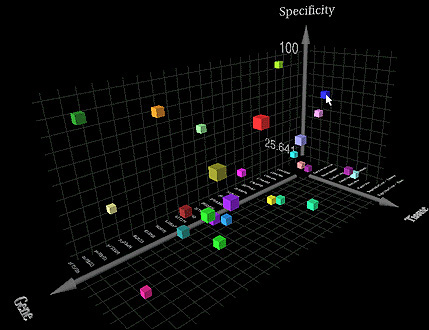 |
Each dot is one gene, color-coded to indicate the tissue where it is made into protein, with the size of the dot indicating how much protein is made from the gene. Dots that are higher in the image represent genes that have few or no known counterparts in other databases.
|
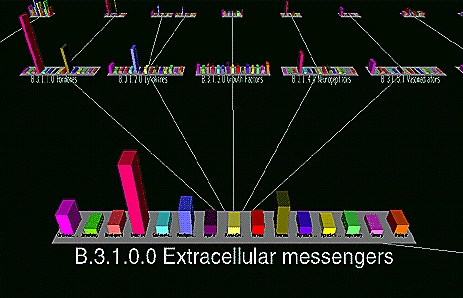 |
| Genes can be grouped based on proposed function (gray boxes) and tissues where they are made into protein (color-coded vertical bars). The functions can be subdivided (proteins that are messengers can be hormones, cytokines (immune cell messengers). etc.). Clicking on any vertical bar gives a list of the genes included in that category. |